


Yes We Can . . . Compare Apples to Oranges
Submitted by rthomas on Thu, 12/21/2017 - 15:27
Thursday, August 19, 2010
One of the criticisms of the current state of the federal government's open data feeds is that they have yet to produce much measurable change in people's daily lives. The cartoon below makes that point, as does Matt Rosenberg's 3/17/2010 post, "Mark Drapeau: Gov 2.0 Apps Need Staying Power" in Social Capital Review. The problem isn't lack of data. What is missing is two components: First, visualizations of the data that incorporate all the important information and present it in easily-understandable formats; second, a means of getting into people's hands at a time when it might influence their decisions.

Certainly, since March of this year, developers have been making progress. Forum One's County Sin Rankings represents a step forward at least on the first component. A few years ago, my wife and I decided to move out of Washington, DC, proper and were looking at either Maryland or Virginia. If we had access to County Sin Rankings, we could have used government data inform our decision. Below is the snapshot comparison of Montgomery County, MD with Arlington County, VA. (Forum One gathers data from County Health Rankings, which collects its data chiefly from EPA, CDC, Census--which is to say Commerce--and the Department of Education)

Now, as a practical matter, I don't know how much this information would have swayed our decision, but buying a home is not an every-day activity and a lot of factors effect the decision.
But then there's food.
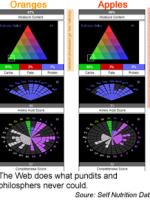
If there's one thing I'd like help with, it's a better way of understanding what the heck is in what I eat. I'm not even talking about Triscuits vs. Wheat Thins. I'm literally talking about apples vs. oranges. I'm talking about walnuts vs. pecans. And I'd like that information not when I'm at home doing a million other things, but when I'm in the store, standing in front of piles of fruit and cans of dry roasted nuts.
Now, a combination of tools allows us to just that. The first step, of course, is publishing the nutritional information of each food. That's the province of the US Department of Agriculture. (Try looking up the nutritional information for a whole grapefruit, one of my favorites. Scientific name, Citrus paradisi, of course!).
But notice that the numbers the USDA gives isn't really a great help. So grapefruit has 310 kiloJoules of energy? Um, ok? Even those elements that I know are good for me, Calcium, Iron, Magnesium, I can't discern if grapefruit is a better choice than oranges or apples. Then along comes the second tool: Self Magazines' Nutritional Data site.
 The site offers a free suite of tools that helps put the USDA's information into a visual presentation that makes sense and allows users to compare apples to oranges (right). This takes a lot of the data: amounts of follate, vitamins, water, calories, fats, etc, and applies a unique analytical perspective to help me understand the data. That's where the private sector plays its role.
Now that we have the information, however, we still need a way to access it in our grocery stores. And that way is called Sticky Bits. Launched in March, just a short time after Matt Rosenberg filed his article, Sticky Bits allows people to scan a bar code and attach information to it (read Tech Crunch's full review). When other people scan the bar code, they will be able to access that information on their phone.
In an ideal world, these components would be merged into a single tool, and I'd happily pay for that. Who do we need to get into a single room to make that happen?